


City Achieves New Record-Low May in Murder and Shooting Incident Categories
June 4, 2019
City Remains Vigilant Against Rise in Hate Crimes
The NYPD announced today that year-to-date index crime is down by more than -2,300 crimes, or -6.2%, as May 2019 saw the lowest number of murders and shooting incidents recorded in any May in the CompStat era. In addition, during the month of May, robbery and burglary saw double-digit reductions.
"New York City has seen a continued reduction in crime, which is reflective of the hard work of members of the NYPD and the commitment of residents across the city. Safety is a shared responsibility, and through Neighborhood Policing and focusing on criminals with precision, we will continue to strengthen bonds with members of the community," said Police Commissioner James P. O'Neill. "With summer on the way, we've deployed additional resources and we’re as focused as ever — together — on those who commit crime and cause disorder."
"Our police department continues to break its own records and May was no exception," said Mayor de Blasio. "Thanks to Neighborhood Policing and the bonds we're forming between our officers and the communities they serve, New York City is on track to remain the safest big city in America."
Key highlights from this month's crime statistics include:
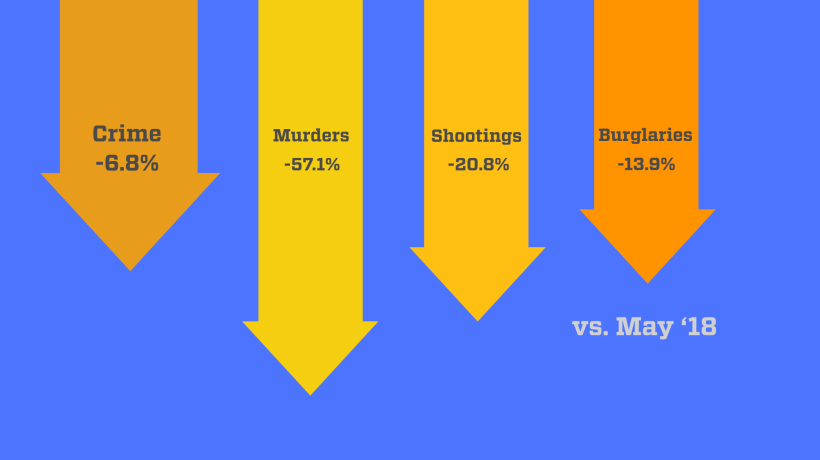
- A -6.8% reduction in index crime in May 2019 (7,818) compared to May 2018 (8,389);
- Reductions in every major index crime category May 2019 compared to May 2018 and year-to-date;
- A -57.1% reduction in murder in May 2019 (15) compared to May 2018 (35). Year-to-date murder is down -12.4%, 2019 (106) compared to May 2018 (121);
- Transit crime -7.0% in May 2019 (199) compared to May 2018 (214);
- A -13.3% reduction in rape in May 2019 (157) compared to May 2018 (181). Year-to-date rape is -7 incidents, or -0.9%. Rape continues to be underreported. If you have been a victim of sexual assault, please come forward. The NYPD’s Special Victims Division 24-hour hotline is 212-267-RAPE (7273);
- There has also been an uptick in hate crimes (see chart below). There is no place for hate in New York City and the detectives of the Hate Crime Task Force are working diligently to eliminate these crimes and to bring perpetrators of hate to justice.
Statistics on Index Crimes 2018-2019
| May 2019 | May 2018 | Change | +/-% | Year-to-Date 2019 | Year-to-Date 2018 | Change | +/-% | |
|---|---|---|---|---|---|---|---|---|
| Murder | 15 | 35 | -20 | -57.1% | 106 | 121 | -15 | -12.4% |
| Rape | 157 | 181 | -24 | -13.3% | 742 | 749 | -7 | -0.9% |
| Robbery | 1,073 |
1,193 | -120 | -10.1% | 4,682 |
5,135 | -453 | -8.8% |
| Felony Assault |
1,823 | 1,940 | -117 | -6.0% | 7,832 | 8,058 | -226 | -3.8% |
| Burglary | 807 | 937 | -130 | -13.9% | 3,997 | 4,608 | -611 | -13.3% |
| Grand Larceny |
3,535 | 3,662 | -127 | -3.5% | 16,027 | 16,778 | -611 | -4.5% |
| G.L.A. | 408 | 441 | -33 | -7.5% | 1,709 | 1,956 | -247 | -12.6% |
| TOTAL | 7,818 | 8,389 | -571 | -6.8% | 35,095 | 37,405 | -3,310 | -6.2% |
Additional Statistics on Transit/Housing Crime and Shootings, 2018-2019
| May 2019 | May 2018 | Change | +/-% | Year-to-Date 2019 | Year-to-Date 2018 | Change | +/-% | |
|---|---|---|---|---|---|---|---|---|
| Transit | 199 | 214 | -15 | -7.0% | 940 | 962 | -32 | -3.4% |
| Housing | 431 | 425 | +6 | +1.4% | 1,974 | 1,910 | +64 | +3.4% |
| Shooting Incidents |
61 | 77 | -16 | -20.8% | 273 | 267 | +6 | +2.2% |
May Rape Breakdowns
| CompStat Year | Count | Occurred Same Year | Occurred Previous Year | Occurred 2 Years Prior | Occurred 3 Years Prior | Occurred 4 Years Prior | Occurred 5+ Years Prior |
|---|---|---|---|---|---|---|---|
| 2019 | 157 | 113 | 12 | 2 | 5 | 4 | 21 |
| 2018 | 181 | 142 | 17 | 5 | 1 | 2 | 14 |
| 2017 | 121 | 102 | 6 | 3 | 4 | 0 | 6 |
| 2016 | 147 | 121 | 9 | 1 | 5 | 1 | 10 |
| 2015 | 120 | 105 | 6 | 2 | 2 | 1 | 4 |
| 2014 | 101 | 88 | 7 | 2 | 0 | 1 | 3 |
Hate Crimes as of 6/2/2019 by Motivation
| Motivation | 2019 | 2018 | Diff | & Change | % of Total |
|---|---|---|---|---|---|
| Asian | 3 | 1 | +2 | +200% | 2% |
| Black | 18 | 14 | +4 | +29% | 10% |
| Ethnic | 0 | 1 | -1 | -100% | 0 |
| Gender | 4 | 3 | +1 | +33% | 2% |
| Hispanic | 3 | 1 | +2 | +200% | 2% |
| Muslim | 6 | 8 | -2 | -25% | 3% |
| Other | 6 | 5 | +1 | +20% | 3% |
| Religion | 5 | 3 | +2 | +67% | 3% |
| Semitic | 110 | 58 | +52 | +90% | 60% |
| Sexual Orientation | 18 | 15 | +3 | +20% | 10% |
| White | 11 | 3 | +8 | +267% | 6% |
| Grand Total | 184 | 112 | +73 | +64% |
Hate Crimes as of 6/2/2019 by Arrest:
| Motivation | 2019 | 2018 | Diff | % of Total |
|---|---|---|---|---|
| Asian | 7 | 0 | +7 | ***.* |
| Black | 6 | 3 | +3 | +100% |
| Gender | 3 | 2 | +1 | +50% |
| Hispanic | 3 | 4 | -1 | -25% |
| Muslim | 6 | 6 | 0 | 0% |
| Non-Bias | 1 | 1 | 0 | 0% |
| Other | 2 | 2 | 0 | 0% |
| Religion | 1 | 2 | -1 | -50% |
| Semitic | 27 | 26 | +1 | +4% |
| Sexual Orientation | 13 | 15 | -2 | -13% |
| White | 6 | 2 | +4 | +200% |
| Grand Total | 75 | 63 | +12 | +19% |
Note: All crime statistics are preliminary and subject to further analysis, revisions, or change.