Cycling in the City
Cycling in the City provides a comprehensive look into cycling trends in our city.
NYC DOT uses data from local and national surveys to determine how frequently New Yorkers ride bicycles, and how that frequency changes over time.
As of October 2022, this is available as a series of interactive graphs.
Highlights
- 1,525 lane miles of bike lanes installed in New York City as of 2022
- 644 lane miles of protected bike lanes installed in New York City as of 2022
- According to the United States Decennial Census’ American Community Survey:
- On a typical day, there are over 610,000 cycling trips made in New York City
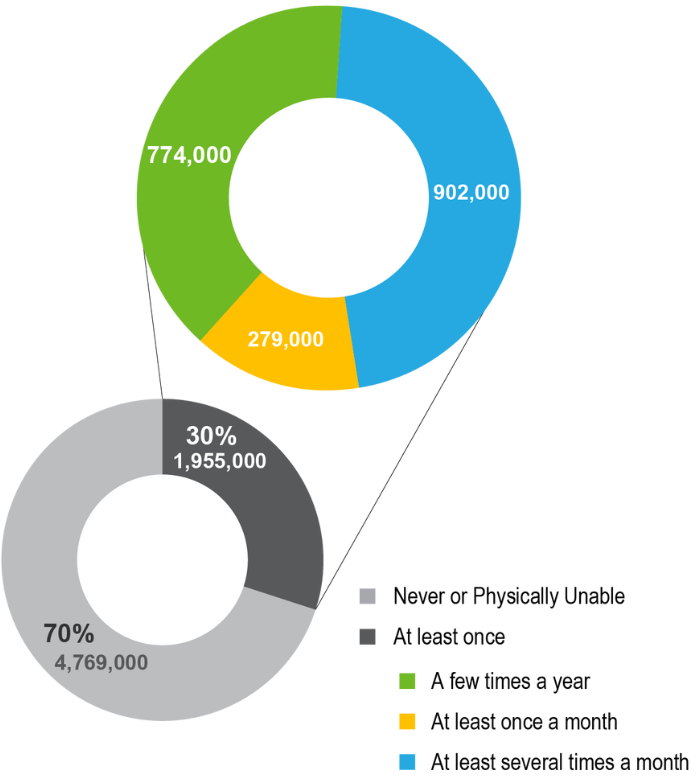
- According to the New York City Department of Health and Mental Hygiene (NYC DOHMH) Community Health Survey:
- 30% of adult New Yorkers (approximately 2 million people) ride a bike
- More than nine hundred thousand (902,000) New Yorkers ride a bike regularly
Trends Over Time
Source: United States Decennial Census’ American Community Survey
Bike Commuters (to work) by Borough
This graph displays the annual growth of commuters who bike in NYC.
+94% Growth
in daily cycling between 2012 and 2022
+25% Growth
in daily cycling between 2017 and 2022
Male and Female Bike Commuters (to work)
This graph displays the annual growth of male and female commuters who bike in NYC.
8%
Ten Year Average Annual Growth Rate of Female Commuter Cycling
Estimates of Daily Cycling Activity by Year
This table displays daily bike commuters in NYC.
| Bike Commuters (to work) | Bike Commute Trips (to work) | Total Daily Cycling Trips | Total Annual Cycling Trips (in millions) | |
|---|---|---|---|---|
| 2008 | 23,500 | 47,000 | 240,000 | 87.6 |
| 2009 | 24,400 | 48,800 | 240,000 | 87.6 |
| 2010 | 25,000 | 50,000 | 250,000 | 91.3 |
| 2011 | 26,900 | 53,800 | 270,000 | 98.6 |
| 2012 | 31,500 | 63,000 | 320,000 | 116.8 |
| 2013 | 37,600 | 75,200 | 380,000 | 138.7 |
| 2014 | 41,800 | 83,600 | 420,000 | 153.3 |
| 2015 | 45,000 | 90,000 | 450,000 | 164.3 |
| 2016 | 45,800 | 91,600 | 460,000 | 167.9 |
| 2017 | 48,800 | 97,600 | 490,000 | 178.9 |
| 2018 | 50,900 | 101,800 | 510,000 | 186.2 |
| 2019 | 52,700 | 105,400 | 530,000 | 193.5 |
| 2021 | 55,000 | 110,000 | 550,000 | 200.8 |
| 2022 | 61,200 | 122,400 | 610,000 | 222.7 |