
 The Mayor's Office for Economic Opportunity311Search all NYC.gov websites


An Economic Profile of Immigrants in New York City
NYC Opportunity's "An Economic Profile of Immigrants in New York City, 2017" contains the most recent information on the economic status of New York City's immigrants. This latest report examines labor force participation, earnings, poverty rates, and other economic measures for immigrants by immigration legal status, such as naturalized citizens, green card holders, and undocumented immigrants.
NYC Opportunity also incorporates legal status of immigrants into an experimental version of the NYCgov Poverty Measure, the New York City-specific poverty measure that NYC Opportunity designed and updates annually. This metric, NYCgov/ImmPov, is of use to policymakers seeking to understand how poverty differs among immigrants by legal status. Non-citizens, in particular, face special economic obstacles, and have historically high poverty rates. This report is updated annually.
Key Findings:
- The undocumented population fell by 167,000 from 674,000 to 507,000 between 2008 and 2017—a 25 percent decline. This decline mirrors trends in national data over the same time period.
- Undocumented immigrants are integral to the City: Just over 1 million New Yorkers live in a household with at least one undocumented immigrant. About 88 percent of the 276,000 children in these households are lawfully resident New Yorkers.
- Immigrants comprise 37.2 percent of the city’s population but 44.2 percent of the labor force.
- Over three-quarters (77.5 percent) of undocumented immigrants are in the labor force compared to the city’s U.S. born population (64.9 percent).
- Despite higher labor force participation and increases in educational attainment, median annual earnings for undocumented immigrants ($25,300) is significantly lower than earnings for U.S.-born citizens ($45,500).
- Incorporating legal status into the NYCgov poverty measure generates a higher poverty rate for the city: 19.5 compared to 19.0.
- Because undocumented immigrants are not eligible for most public benefits, their poverty rate is high relative to the other immigrants. The foreign-born poverty rate is 22.1 compared to 28.8 for undocumented immigrants, a decline of 6 percentages points from a rate of 34.8 in 2013.
- Naturalized citizens have a socio-economic profile that is more similar to the U.S.-born population than other foreign-born groups. Naturalized citizens have higher median annual earnings than for the total city; $39,400 compared to $38,400. And their poverty rate, after accounting for legal status, is the same as for the U.S.-born.
Past Immigrant Economic Profile Reports
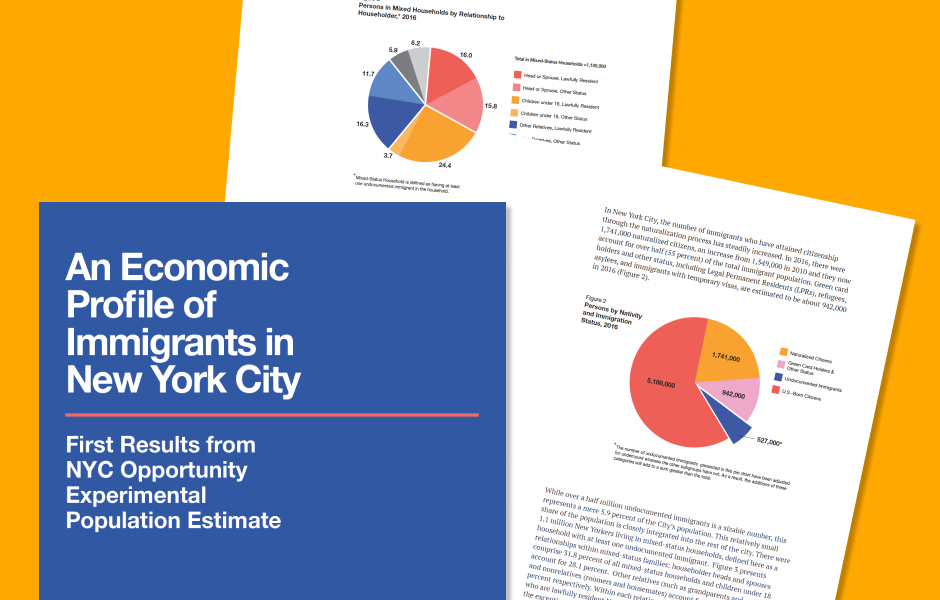
“An Economic Profile of Immigrants in New York City: First Results from NYC Opportunity Experimental Population Estimate.”
Released June, 2018