
 Department of City Planning311Search all NYC.gov websites


Visualizing NYC
Migration Research
As the key component of population change, an understanding of migration forms a foundation for major planning and policy decisions. The following visualizations comprise an ongoing series of in-depth explorations of the attributes of migrants both into and out of the city, over time.
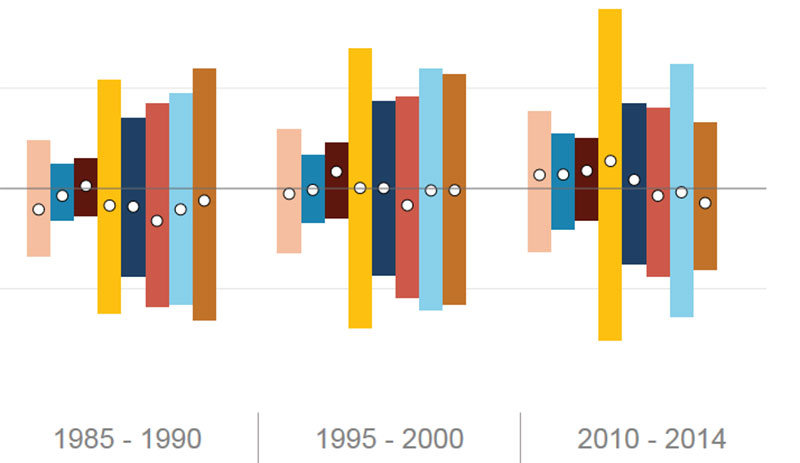
Characteristics of Migrants – This interactive chart explores historical flows to and from NYC for migrants with various demographic and socioeconomic characteristics, shedding light on the effect of net migration on the composition of NYC’s population.
A two-page information brief, ![]() Migration to and from NYC, provides an overview of the key trends in migration to and from NYC over time and is available on the Reports and Presentations webpage.
Migration to and from NYC, provides an overview of the key trends in migration to and from NYC over time and is available on the Reports and Presentations webpage.
Mapping Language
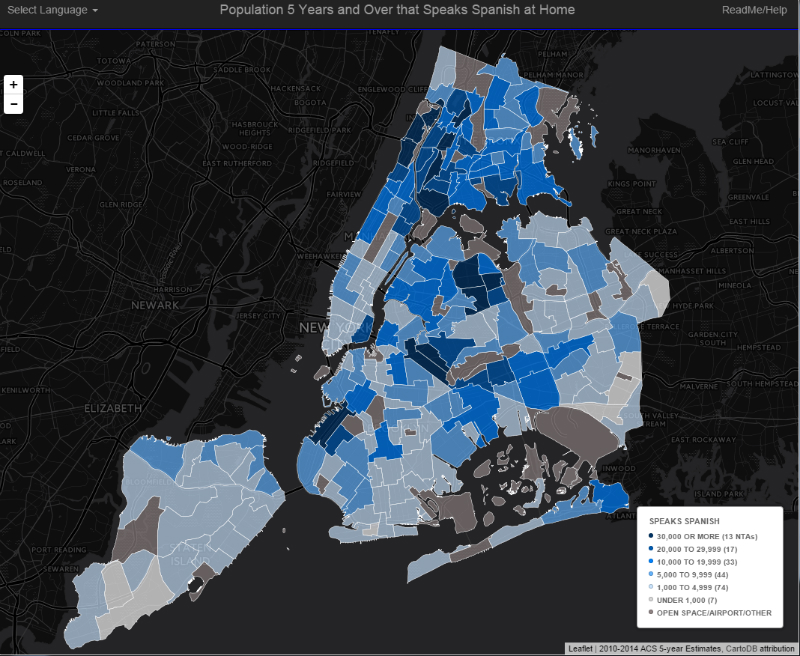
Interactive Maps showing where top languages are spoken by NYC residents.
NYC at a Glance

![]() Items accompanied by this symbol require the free Adobe Acrobat Reader.
Items accompanied by this symbol require the free Adobe Acrobat Reader.