
 Department of City Planning311Search all NYC.gov websites


New Projects!
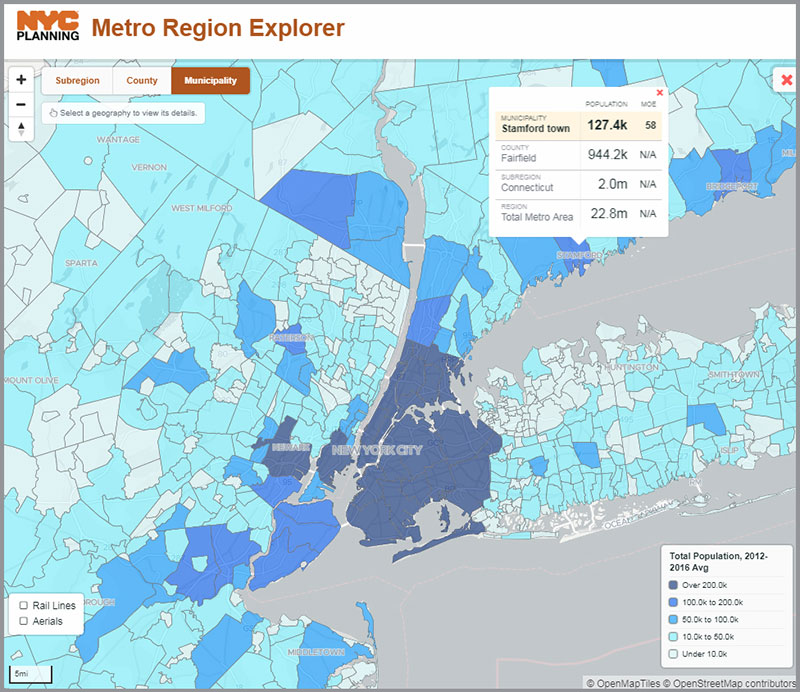
The NYC Metro Region Explorer is an interactive map showing population, housing, and employment trends within the tri-state NYC metropolitan region, and shares key insights about how the region has changed from 2000 to today.
NYC Metropolitan Region
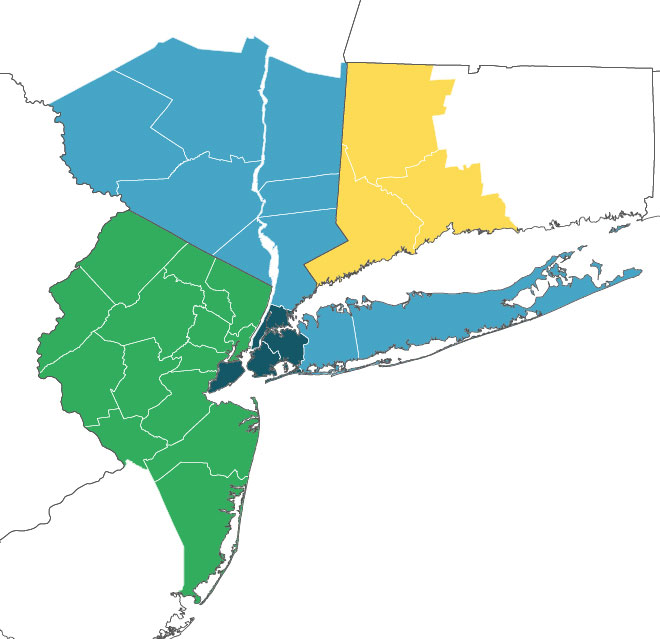
New York City is the center of a dynamic tri-state metropolitan region with nearly 23 million people and more than 10 million jobs, representing 10% of the nation’s economy. Though NYC is by far the most populous city, with 40% of the regional population living in the five boroughs, we are one of nearly 1,000 municipalities that make up our metropolitan area.
Our region is changing, and it is important to confront prospective challenges together. New York City recognizes that working with our neighbors to plan for the future is essential to the strength of the region, and that strong communities around the city make the New York metropolitan area more nationally and globally competitive and a better place to live for all New Yorkers.
One Region: A Metropolitan Perspective on New York City's Future
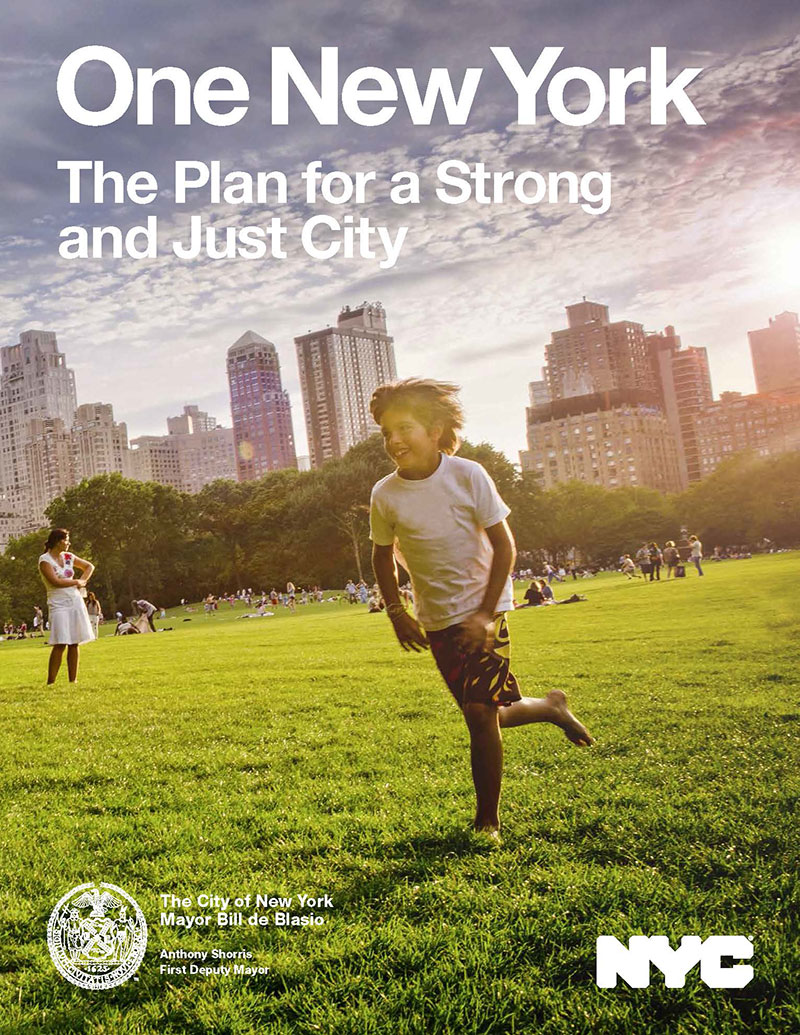
NYC’s 2015 Strategic Plan, ![]() One New York: The Plan for a Strong and Just City (OneNYC), articulated an ambitious blueprint for growth and development in the 21st century — one that would continue to support the world’s most dynamic economy and ensure that New York remains a place where families, businesses and neighborhoods thrive. With a focus on sustainability, livability, equity and resiliency, the plan’s initiatives highlight the relationship between NYC and its regional neighbors in achieving our vision.
One New York: The Plan for a Strong and Just City (OneNYC), articulated an ambitious blueprint for growth and development in the 21st century — one that would continue to support the world’s most dynamic economy and ensure that New York remains a place where families, businesses and neighborhoods thrive. With a focus on sustainability, livability, equity and resiliency, the plan’s initiatives highlight the relationship between NYC and its regional neighbors in achieving our vision.
To fulfill the city’s vision in applying a regional lens to our citywide planning efforts, OneNYC recommended that the NYC Department of City Planning create a new Regional Planning unit to:
- Analyze regional population, economic and land use trends.
- Work with other municipalities and local governments throughout the metropolitan region, as well as their local planning departments, to more closely coordinate regional planning initiatives.
- Identify challenges that face the region as a whole and help shape regional responses to leverage collective strengths and address shared challenges.
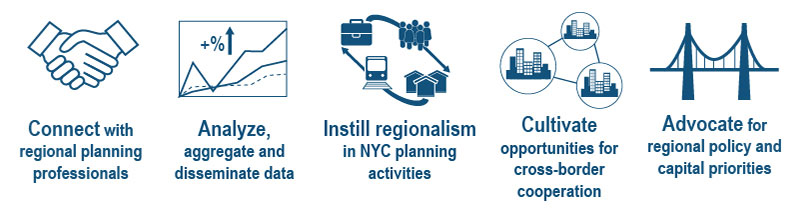
To enhance New York City’s ability to understand and affect regional-scaled planning issues, the City has five key objectives:
The New York City tri-state metropolitan region is complex, marked by layers of governance and divided management of our shared infrastructure By dedicating resources to a regional planning office, NYC is reaching out across our borders, and investing in a more connected, strong and equitable metropolitan future.
For more information, please contact us at regional@planning.nyc.gov
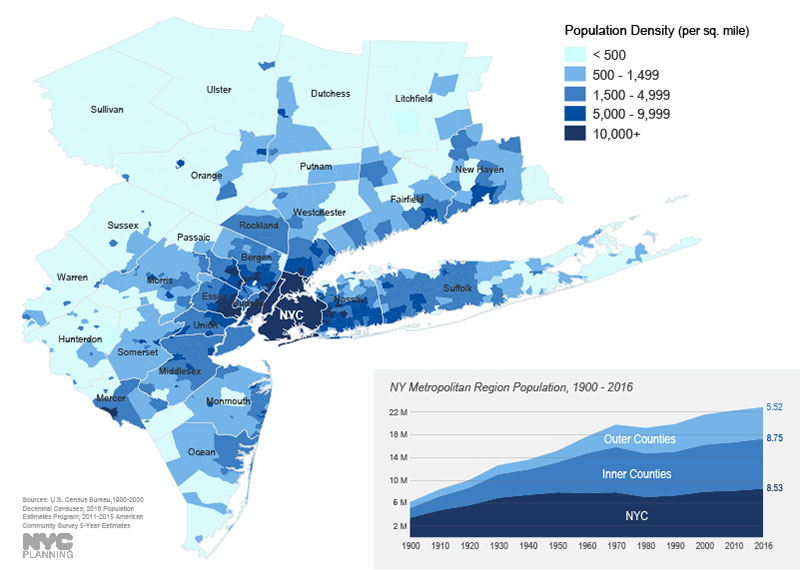
Today we are a region of 22.8 million people and over 10.2 million jobs, and growing!
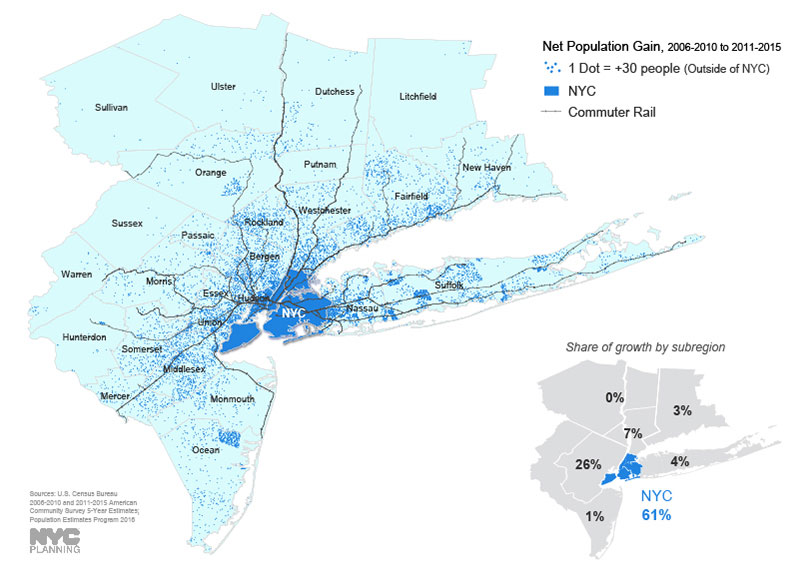
According to the U.S. Census Bureau, the 31-county tri-state region grew by 2.7% from 2010 to 2016. The nearly 600,000 people added is more than any other region in the country, and is equivalent to the entire population of the city of Boston. Over 60% of that growth was in NYC alone, which at 8.53 million people—a historic population high for the city—represents 40% of the region’s total population. Growth in the region’s core represents a departure from regional growth of the 20th century, which was characterized by suburbanization and outward expansion.
For more information on population trends within New York City, please visit the NYC Population section of our website, or for more information about economic trends within the city, please visit the NYC Economy section of our website.
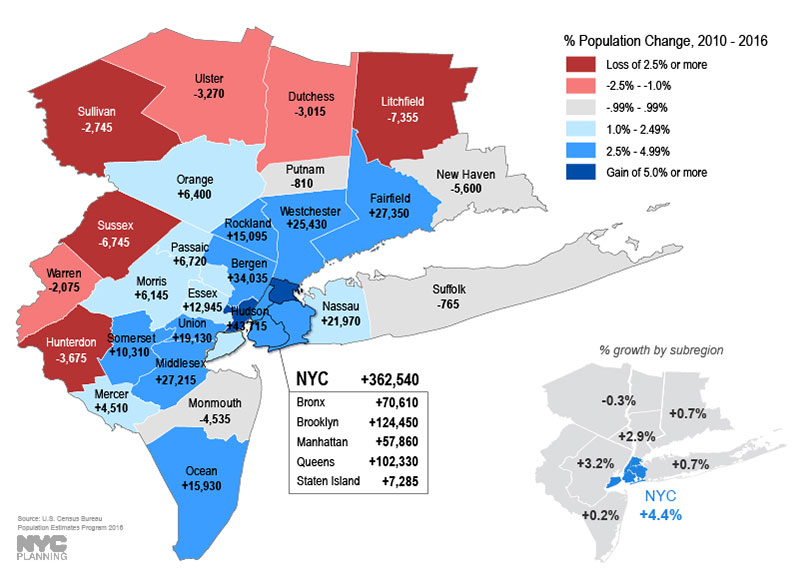
Post-recession, our region is re-centralizing.
Recent migration patterns suggest that more people are moving to and staying in our region, with a focus on the urban core in areas connected to transit. This is especially true for NYC, which accounted for 60% of regional population growth since 2010. Hudson County, New Jersey saw the fastest rate of population growth (+6.9%), as well as the largest net population gain (+43,700) outside of NYC.
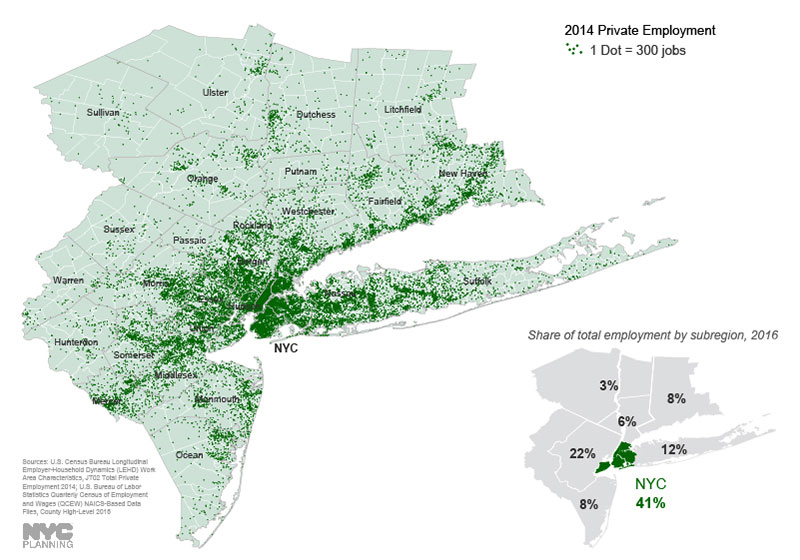
This trend is more pronounced in employment changes NYC accounted for 88% of the region’s net total private jobs gain post-recession, adding more than 416,000 jobs from 2008 to 2015. As a result, NYC is at an all-time peak of employment, while many areas of the region have not fully recovered from the recession.
Less central parts of the region with limited transit links, which led growth during the second half of the 20th century, are generally not growing. Our region’s future now depends on how well we plan for population and jobs in highly connected, transit-oriented neighborhoods.
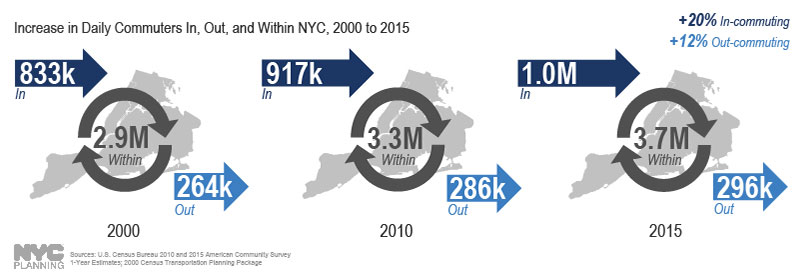
As a result, our transit and infrastructure are under enormous pressure.
Strong population growth in inner counties and growing demand for commutation into NYC increases the strain on our aging rail and road networks. In the last five years, commuting into NYC for work increased from all directions, with the most significant increases coming from across the Hudson River. Strong population growth in Northern New Jersey has not been matched by job growth, and the resulting geographic mismatch increases the number of commuters trying to enter Manhattan through the already strained Hudson River crossings. Moreover, New Yorkers are increasingly accessing job opportunities throughout the region, with more than 450,000 NYC residents employed by businesses located outside of the city.
If job growth can be cultivated at locations throughout the region, particularly ones that are accessible by multiple transit services, this can reduce the extent of infrastructure investment needed to accommodate population and economic growth. We need to think regionally about long term investments, jobs and population growth patterns that support efficient and reliable mobility across our congested region.
Housing supply and affordability is a regional problem.
Around 45% of renter households in the NYC region are rent-burdened, with rents rising and incomes stagnating across the board. NYC has adopted an aggressive policy to build more market rate and subsidized housing, but the city alone cannot alleviate the pressure. According to the U.S. Census Building Permit Survey, from 2010 to 2015 NYC accounted for 44% of the 271,000 new housing permits and 60% of all multifamily permits, despite region-wide population growth. We must work together across the region to stimulate housing production and relieve the burden on households of all income levels.
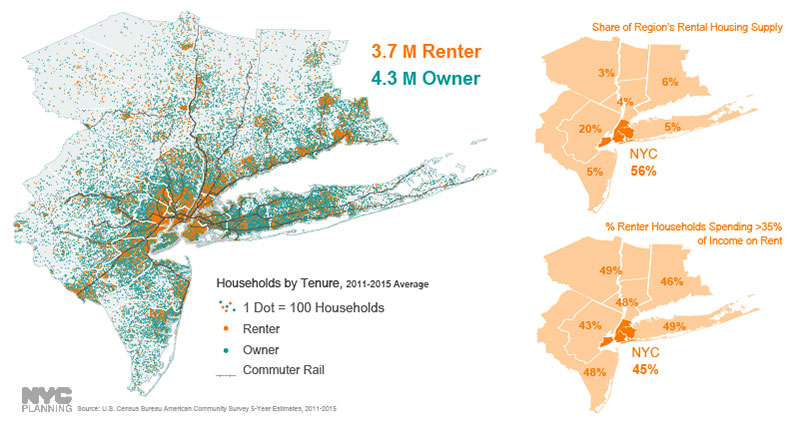
According to the U.S. Census Bureau, the region is nearly split between renter-occupied and owner-occupied households. The majority of renter householders are in NYC and inner New Jersey, accounting for 56% and 20% of the region’s share respectively. Despite concentration in the core, nearly half of all renter households throughout the region reported spending more than 35% of their income on rent.
Our communities are increasingly diverse and interconnected—so we need to be as well.
With over 6 million foreign-born residents from 110 countries, and newcomers from throughout the U.S., our region has always welcomed those in search of economic opportunity and a better quality of life. Whether living in NYC, working in NYC, or accessing recreation, education, and healthcare, this region is home to the greatest concentration of interconnected assets in the nation. We should work across borders to effectively plan for the future in this dynamic environment supported by our shared resources.
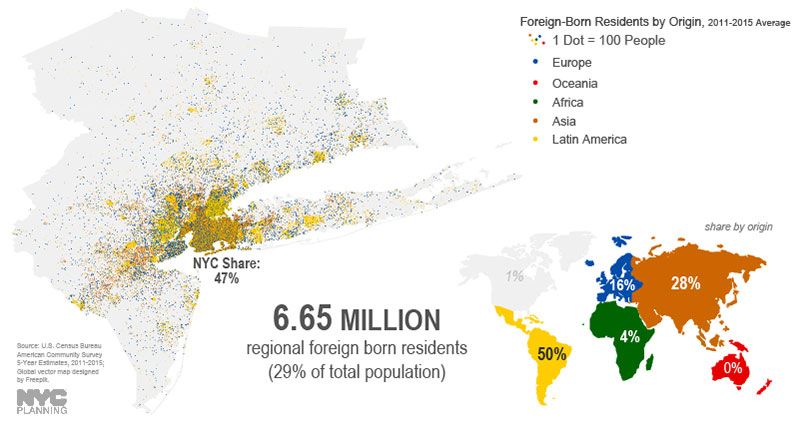
According to the U.S. Census Bureau, over 6.65 million residents of this region are foreign born, accounting for 29% of the region’s population. Latin America and Asia represent the greatest share of foreign born residents, 80%. Of the total regional foreign born population, about half reside in New York City.
![]() Items accompanied by this symbol require the free Adobe Acrobat Reader.
Items accompanied by this symbol require the free Adobe Acrobat Reader.